Data Hub

Data Hub

The Office of Sustainability data hub serves to increase sustainability data transparency and accessibility. This hub contains data visualizations with interactivity to provide the public with a better understanding of our sustainability initiatives and goals. These visualizations may evolve or change over time as they are updated to reflect current data and survey results. If you have any questions about the visualizations or source datasets, please reach out to sustainability@chapman.edu.

2022 Sustainability Survey Results

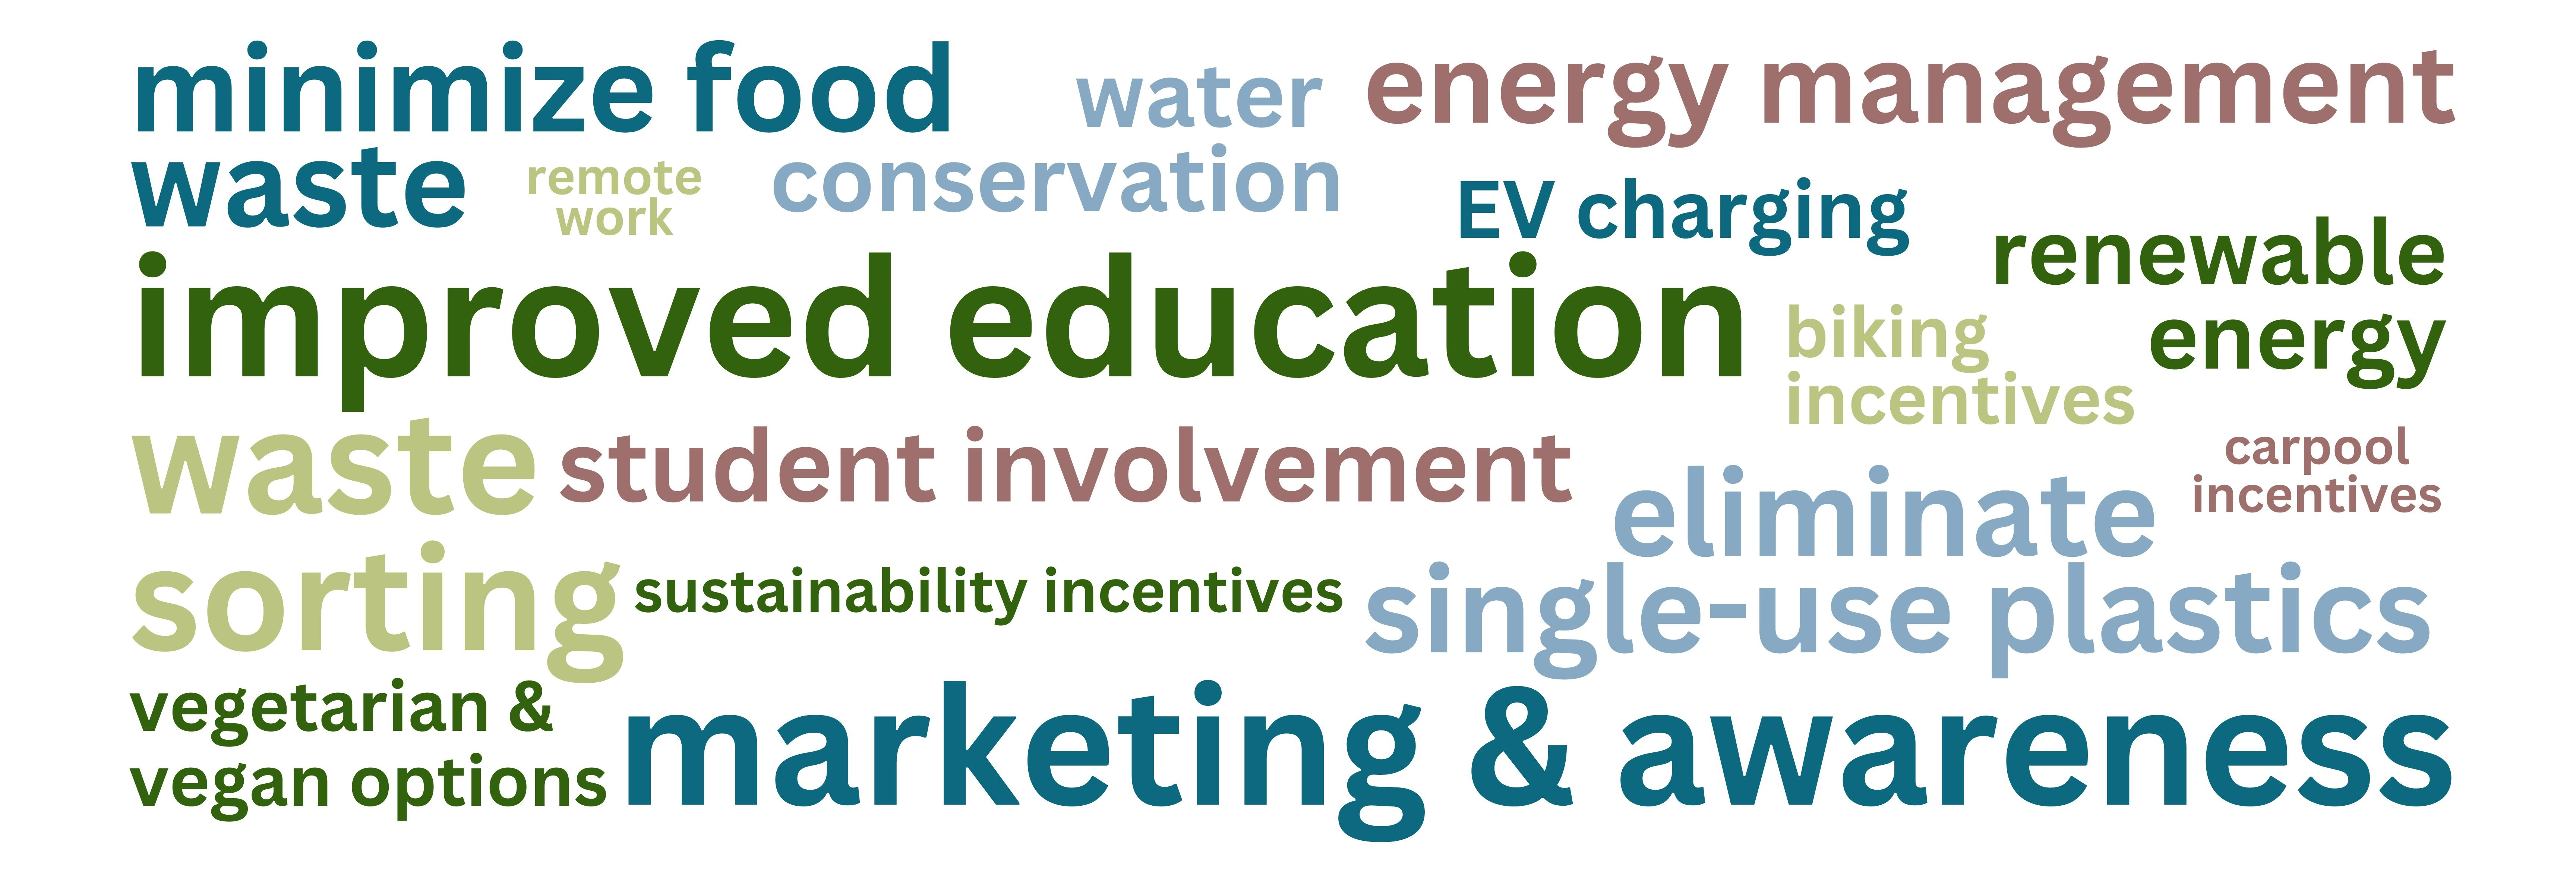
The Office of Sustainability continually seeks feedback on our projects and programming related to energy and water conservation, food waste reduction, education, and more. We release a survey every year in which we invite students, staff, and faculty to provide input on our current and potential future efforts and share ideas on sustainability initiatives they think Chapman should prioritize. Explore the results of our 2022 Sustainability Survey with the below visualizations and supplemental information.

Energy & Water Conservation

Energy & Water Conservation
Respondents were asked to rank the water and energy conservation initiatives displayed below from 1 to 5, 1 indicating the highest priority and 5 indicating the lowest priority. This visualization shows the percentage of respondents that ranked each initiative as the highest priority. Interact with the visualization by clicking on the section of the pie chart to highlight a particular conservation initiative. Click the arrow to go to the second page and view the chart broken down by respondent affiliation (student or staff/faculty.)


Sustainability Curriculum

Respondents were asked to rank the curriculum initiatives displayed below from 1-4, 1 indicating the highest priority and 4 indicating the lowest priority. This visualization shows the percentage of respondents that ranked each initiative as the highest priority. Interact with the visualization by clicking on the section of the pie chart to highlight a particular curriculum initiative. Click the arrow to go to the second page and view the chart broken down by respondent affiliation (student or staff/faculty.)


Food Sustainability Initiatives

Respondents were asked to rank the food sustainability initiatives displayed below from 1-4, 1 indicating the highest priority and 4 indicating the lowest priority.This visualization shows the percentage of respondents that ranked each initiative as the highest priority. Interact with the visualization by clicking on the section of the pie chart to highlight a particular food sustainability initiative. Click the arrow to go to the second page and view the chart broken down by respondent affiliation (student or staff/faculty.)


Waste Reduction

Respondents were asked to rank the waste reduction initiatives displayed below from 1-4, 1 indicating the highest priority and 4 indicating the lowest priority. This visualization shows the percentage of respondents that ranked each initiative as the highest priority. Interact with the visualization by clicking on the section of the pie chart to highlight a particular waste reduction initiative. Click the arrow to go to the second page and view the chart broken down by respondent affiliation (student or staff/faculty.) 


Purchasing Policy

Respondents provided input on the extent to which they believe Chapman should pursue the development of a sustainable purchasing policy. A sustainable purchasing policy sets forth guidelines that various University departments and colleges would follow to procure goods and services that consider the economic, environmental, and social impact of our spending. 


How can Chapman improve its support for sustainability initiatives?

With this open-ended question, we gave students, staff, and faculty the floor to share any feedback they have for the Office of Sustainability. This commentary is valuable in helping our office shape future programming and determine where to best focus our resources. Explore the word cloud below to see what sustainability initiatives the Chapman community is most interested in - the bigger the word/phrase, the more frequently it appeared in the responses we received. 

 word cloud

Greenhouse Gas Benchmarking Reports

Chapman collects and analyzes data on energy, waste and transportation every year to produce a comprehensive emissions report for the university. These reports allow us to track our ecological footprint reduction throughout the years and compare our sustainability and energy conservation performance to our peer institutions.